
In the last year, Share of Search metric has been talked about more and more. And it’s no wonder. If you want to evaluate the market share of your brand as compared to competitors, it’s one of the more precise indicators. It’s being called a substitute for Share of Voice, with the difference that you can determine the Share of Search easily, quickly, and for a fraction of the cost. Can we truly interchange the two metrics? And what should you watch out for when gathering and evaluating data?
What is Share of Search?
Share of Search is a metric that is most often used for expressing a particular brand’s proportion of Google searches compared to that brand’s direct competitors. To determine it, we use the most available sources of search data – Google Trends, or better, Keyword planner in Google Ads.
More important than the current state is the performance of individual shares over time. You don’t have to compare only brands. Search data can help you determine demand trends for products and services as well as movement of the entire market, seasonality, and perhaps even something about your competitors’ marketing communication and strategies.
You can use the metric for many purposes; we will look at some of them later. We will primarily address its most common use – analysis of a brand’s share in relation to its competitors.
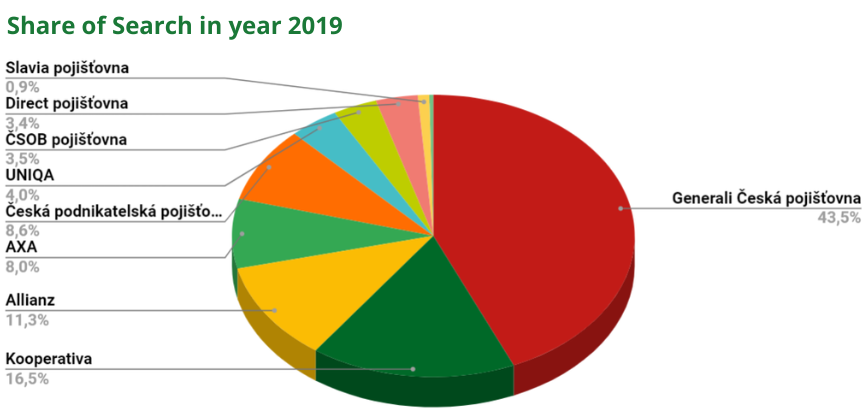
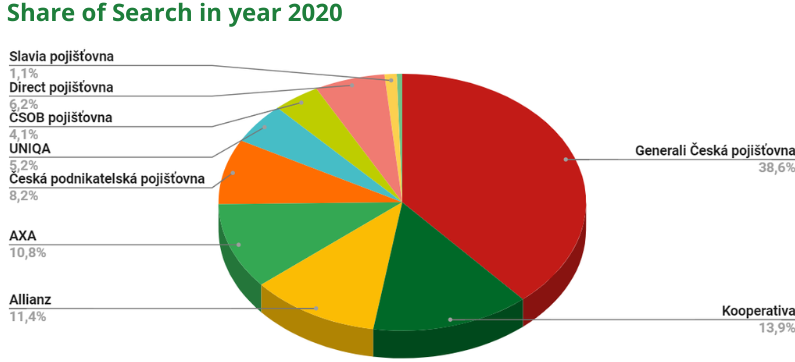
For our client, the Czech insurance company Direct, we analyzed the Share of Search among the biggest brands in the insurance market. From the data, we can see that Direct is growing significantly, while some of the bigger brands are losing their share.
Modern version of Share of Voice
The Share of Search metric has been referred to as a substitute for Share of Voice in the last year. However, the two metrics have different bases and express different values. They can complement each other, but we should not interchange them.
Share of Voice expresses the share of marketing investments compared to total investments of all the advertisers in a given product category or vertical. The value can be calculated relatively easily for offline marketing with standard metrics. But that’s almost impossible in the online environment.
An ever-increasing percentage of marketing budgets are being shifted to the internet; Share of Voice thus loses its accuracy.
Why is it still important to measure Share of Voice?
There is a relationship between the size of investments in the brand and market share size (measured by turnover or number of sales). Very simply, if you have a market share of 40%, you need a 40% Share of Voice to keep it.
The reality is a bit more complicated. Big players in the market can invest less than their market share and still grow. On the other hand, smaller players need to invest more to keep their share, and if they want to grow, they need up to double SoV than their current Market Share. Share of Search measures users’ current interest in a given brand together with historical performance. Just like with Share of Voice, it’s possible to predict future performance based on changes of shares in time.
We could argue that the number of brand searches reflects the amount invested in advertising, and thus the metrics are very similar. But unlike Share of Voice, Share of Search results do not only reflect marketing investments; search can also be increased by negative PR.
On the other hand, a brand campaign may not be reflected in searches at all, while a birthday sale can temporarily bring a bigger increase of the share compared to competitors. Share of Search has several pitfalls which you need to keep in mind when evaluating the data. We will discuss them later in the article.
In short, we can say that search reflects the results of all activities happening around your brand, not just the volume of your investment.
Therefore, SoV and SoS metrics work best together. The data from both metrics over time can indicate how much the investments in ads paid off. You can gain insights for analysis of both your marketing communication and that of your competitors, and you can use the data for ideal timing of activities in the next period. If you plot data from SoV and SoS on a chart, it can show you how much and where investments in ads paid off. You can also easily analyze both your marketing communication and that of your competitors and plan timing for the next period very well.
Share of Voice reflects conditions at the top of the shopping funnel, while Share of Search gives you information about performance and the number of potential customers at the bottom of the funnel, closer to the real action.
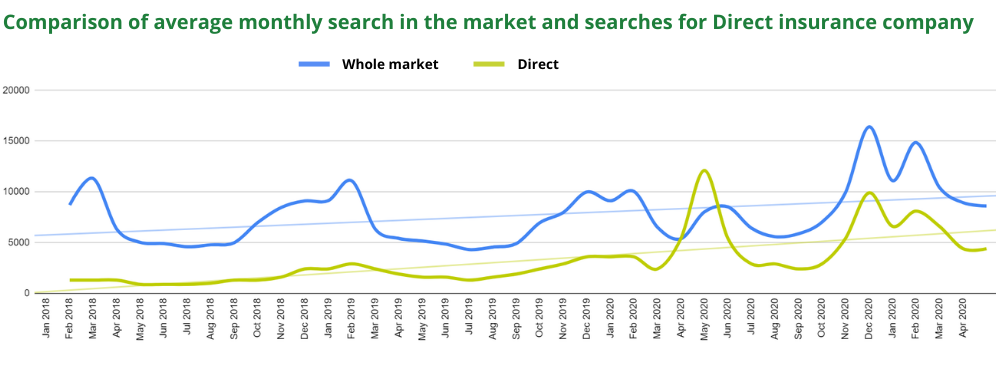
To visualize our client’s growth, we evaluated the average search for all the market’s main brands and compared it to searches for Direct. In the chart, you can see Direct’s long-term growth and its approach to the market average. By noting fluctuations that do not correlate with the market’s ups and downs, you can identify your brand’s strength in particular periods as well as the impact of marketing and other activities.
Searched brand = popular brand?
Quality marketing communication in effective campaigns ideally contributes to both. But searching also reflects negative publicity, which has nothing to do with real market share. It’s even more important, then, to take interest in the reasons behind non-standard fluctuations. Negative publicity doesn’t have to be a big scandal which spills out beyond the online world. One dissatisfied influencer is enough. The peak in searches resulting from this kind of negative publicity can devalue data from an entire year in less-searched fields.
This exposes a potential weakness of the Share of Search metric. Negative publicity usually isn’t really an advertisement, and real share can be significantly lower than the data show.
In reality, we rarely encounter significant anomalies; fluctuations usually reflect the innovative approach of fast-growing new players in the field and interesting (or just very expensive) campaigns.
What should you watch out for when evaluating data?
- The results do not reflect the real market share; they’re simply an indicator.
- Trying to grasp market performance based on monthly data can be very inaccurate – 30 days is a short time for changes in brand perception to take effect. We recommend that you focus on comparing quarterly data, though even longer-term data is ideal. It’s convenient to follow ongoing monthly performance, as it reflects the effect of current campaigns. But you cannot use this to smooth out sudden fluctuations which often cause unnecessary panic.
- The relevance of chosen keywords is fundamental for correct results. Is your brand named Apple or Windows? Be prepared for the results to be significantly affected by searches for ordinary apples and windows. It’s necessary to be very specific with the search phrases. Search phrases are always highly individualized. This is where you fully experience the hardships of a badly chosen generic brand.
- Customers won’t be able to spell some brands correctly. Keep this in mind and work with diacritics and word order. Google cannot always assess synonyms correctly and take them into account in the results.
- Are my competitors actually my competitors? Follow their products and focus, e.g. B2B or B2C segment. After some time, you might find out you’re playing on a different field. It won’t make sense to include this competitor in your analysis anymore.
- Is your target group even online? And are you online? If you target customers who use the internet rarely and therefore you aren’t online much, the actual value of search results can be negligible.
- Is your brand rarely searched for? Or is the name so generic that you have to evaluate long-tail keywords? Google Trends may not even show the data. Google Ads Planner will display results from a few dozen searches per month. However, such low numbers are extremely sensitive to any fluctuations, so using them to draw conclusions may not make sense.
- A lot of time can pass between search and conversion, and in that time, the position of the brand among its competitors from a sales point of view can also change. From experience, we know that the delay may be negligible: sales immediately show up in fluctuations in brand searches. At other times, the delay can last several months. This depends on the goods or services segment – from consumer goods on one side to car purchases on the other. If you can identify this delay, current data can indicate future sales performance.
- Conversion rates of websites can vary significantly, and so the search may not at all reflect the real number of sales of your competitors.
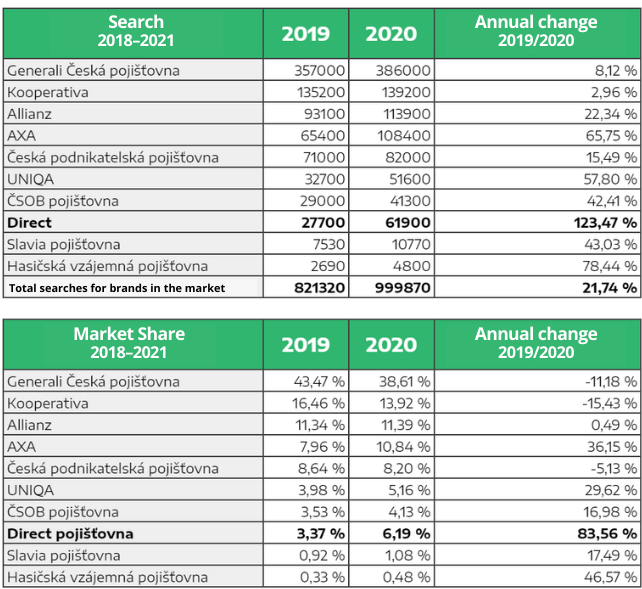
More searches of your brand doesn’t necessarily mean your company is growing in comparison with competitors. Even though they have higher year-on-year searches, market shares of Generali Česká pojišťovna and Kooperativa insurance companies have decreased based on searches. The market itself is constantly changing, so to increase your share, you need to grow faster. Direct insurance company is a good example of this is – its brand search increased at an above-average rate, and thanks to that, its Share of Search grew significantly.
Share of Search is a metric every brand should track and evaluate continuously. There are many factors at play here, but to get started it’s essential to focus on these three:
- Choose truly direct competitors (as customers view them) who match your company in their focus and range of products.
- Based on individual analysis needs, choose relevant keywords.
- When evaluating data, take possible short-time fluctuations into account and try to work with longer periods of time.